Case study · brand strategy & website design · Brand consultancy (our own site) mikebrucedesign.com
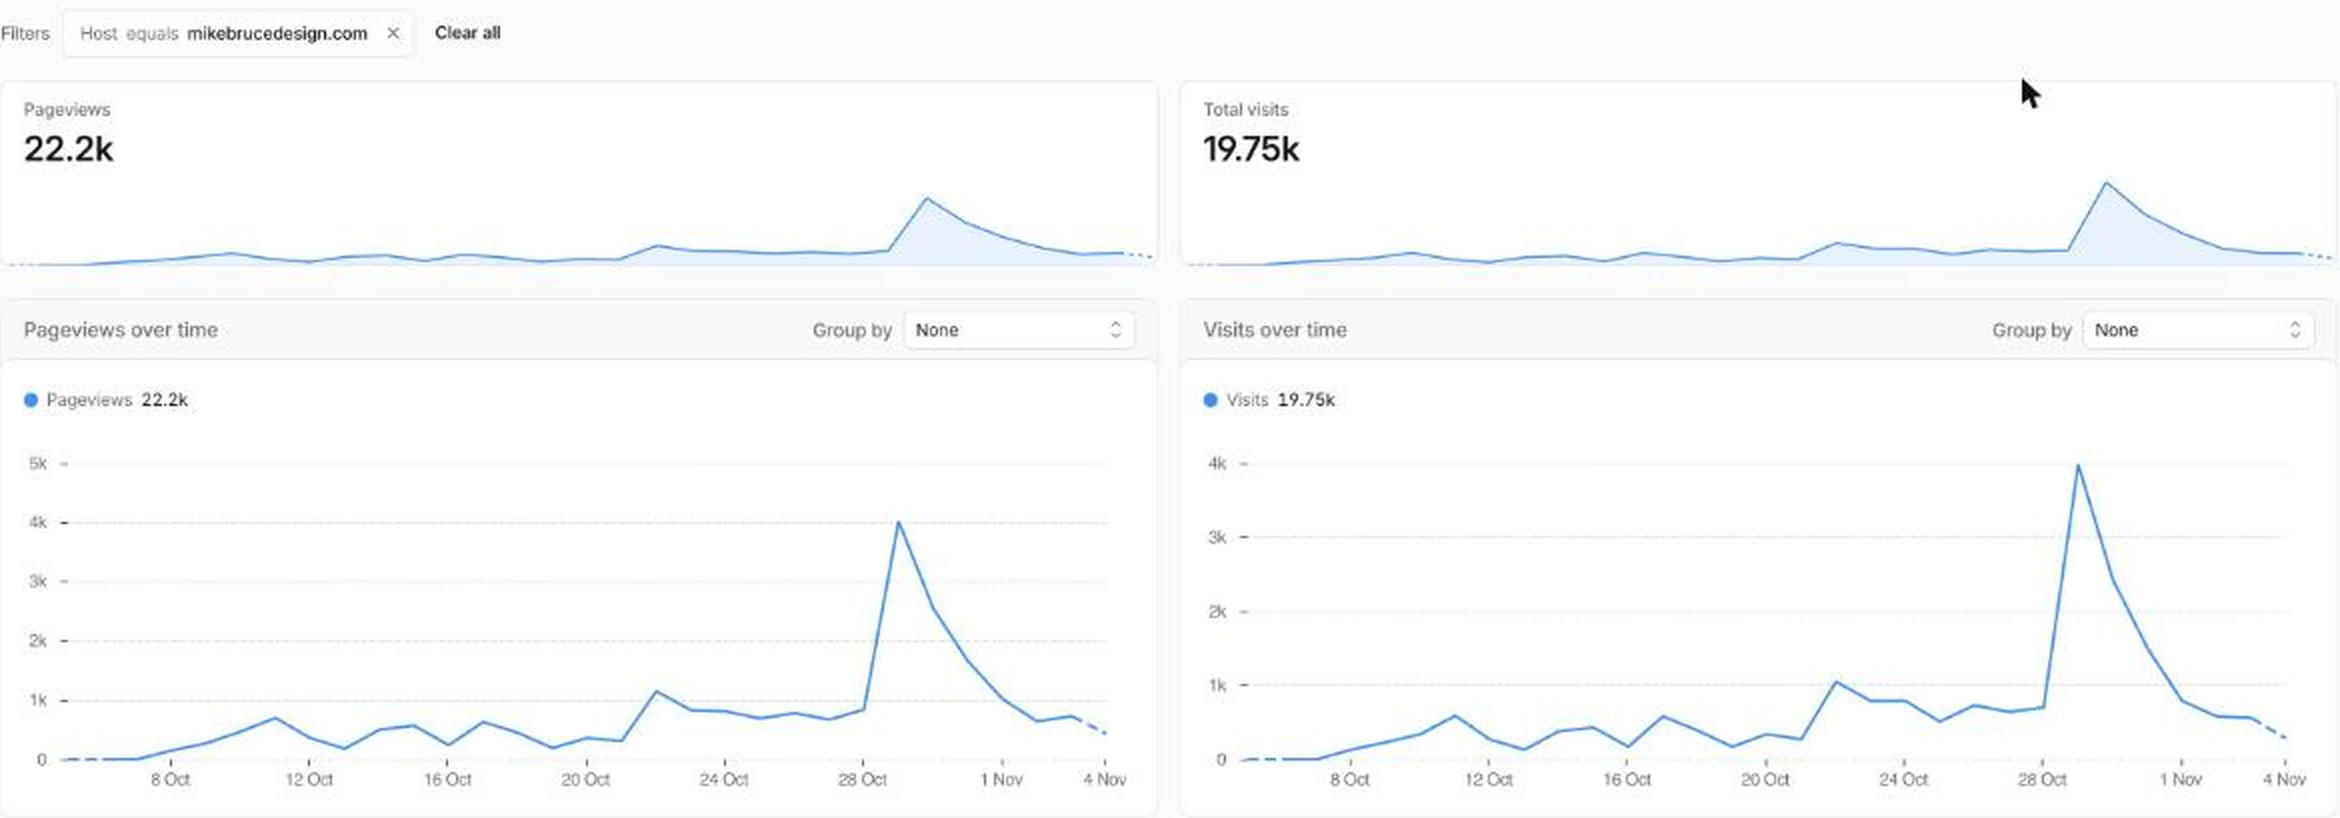
What our redesigned website recorded in the 30 days to 4 November 2026, with the bot traffic shown.
Case study · Mike Bruce Design
22.2k
pageviews recorded by Cloudflare in 30 days. About half are browser traffic. We show both.
Where the 22.2k came from
01 · Overview
We rebuilt our own website on the same system we use for clients, then published what Cloudflare recorded in 30 days: the headline number, the automated traffic inside it, and what the data cannot prove.
Mike Bruce Design is a brand growth consultancy. Our own website is the shop window for the method we sell, the Brand Growth OS: Clarify, Construct, Connect, Convert.
We rebuilt the site on that method and relaunched it on 11 October 2026. This page reports what Cloudflare's analytics recorded for the main site in the 30 days to 4 November 2026.
02 · Challenge
A consultancy that cannot grow its own audience has not earned the right to sell growth.
Most brand consultancies show client logos and say nothing about their own numbers. We decided to apply the system to ourselves and to publish the result, including the parts that flatter us less.
That meant two things: building a site that search engines, AI assistants and busy founders can understand quickly, and reporting traffic honestly in a market where raw pageview counts are easy to inflate and hard to trust.
03 · Solution
The same four phases, pointed at ourselves.
Clarify™: one position, one buyer. The site says who we serve, what we fix and what we will not do, in plain English, so a founder can place us in ten seconds.
Construct™: one identity standard. The site draws on one set of colour, type and layout rules, plus a template library, so nothing on it looks borrowed.
Connect™: website and digital presence architecture, and a content system. Structured data on every page, an llms.txt file for AI assistants, one page per service and per buyer. The Brand Code newsletter and our Voices industry takes put sourced writing on the site every day, shared where founders already read.
Convert™: proof and a next step on every page, from a free Brand Growth Audit™ and working tools to a Brand Clarity Call. This case study is part of it: the reporting loop made public. No paid media was pointed at the main site.
The numbers, as recorded
22,200 pageviews recorded. About 11,100 from browsers.
22.2k
Pageviews on mikebrucedesign.com
Main site host only, 30 days to 4 Nov 2026
19.75k
Visits
Cloudflare counts a visit as one or more pageviews from one visitor
11.1k
Browser-traffic pageviews
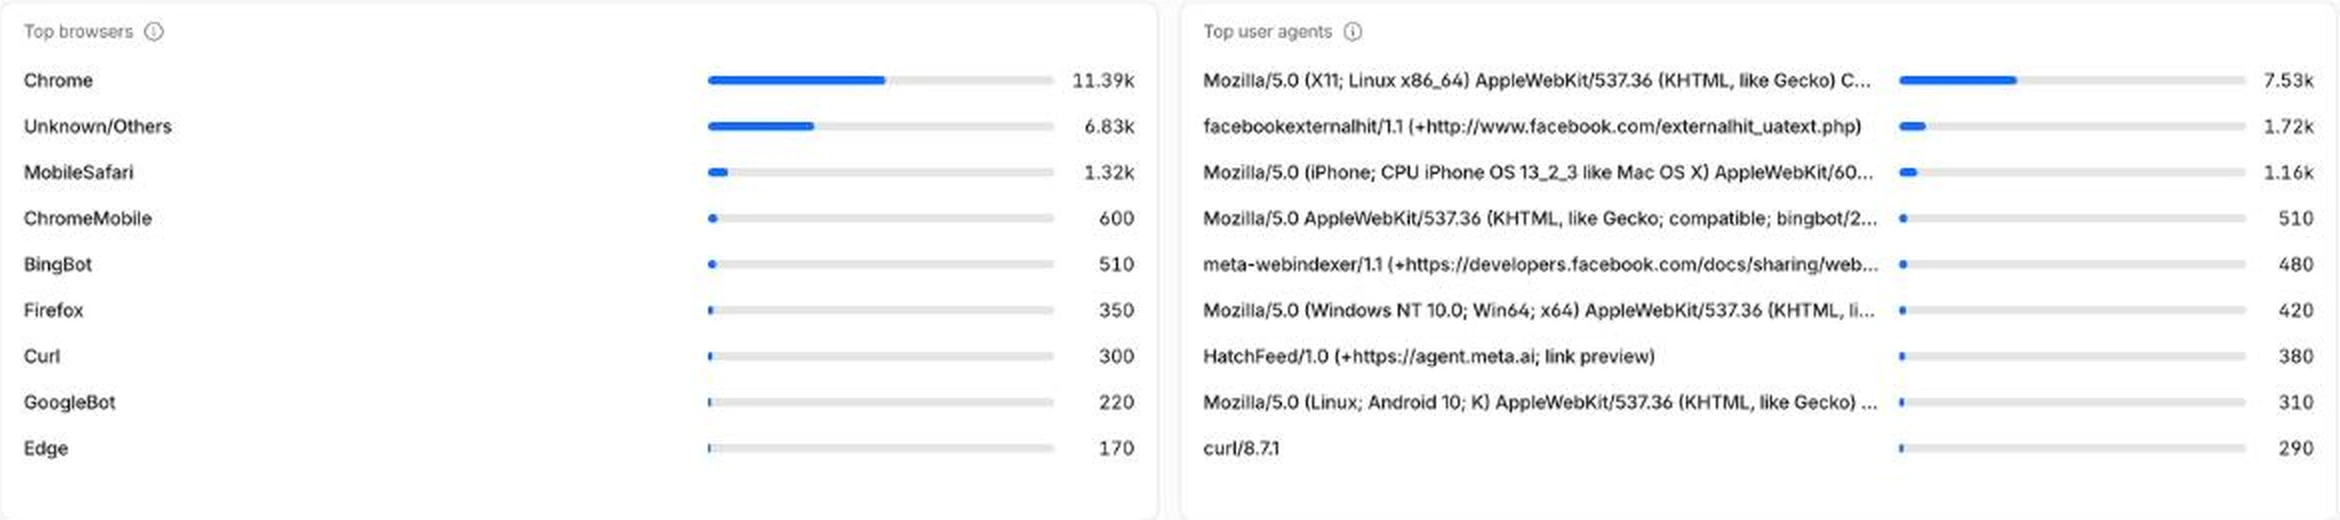
No automation markers in the user-agent signature. The split is below.
72%
From the United States
16.06k of 22.2k pageviews. About 5.2k of them are browser traffic, still more than any other country.
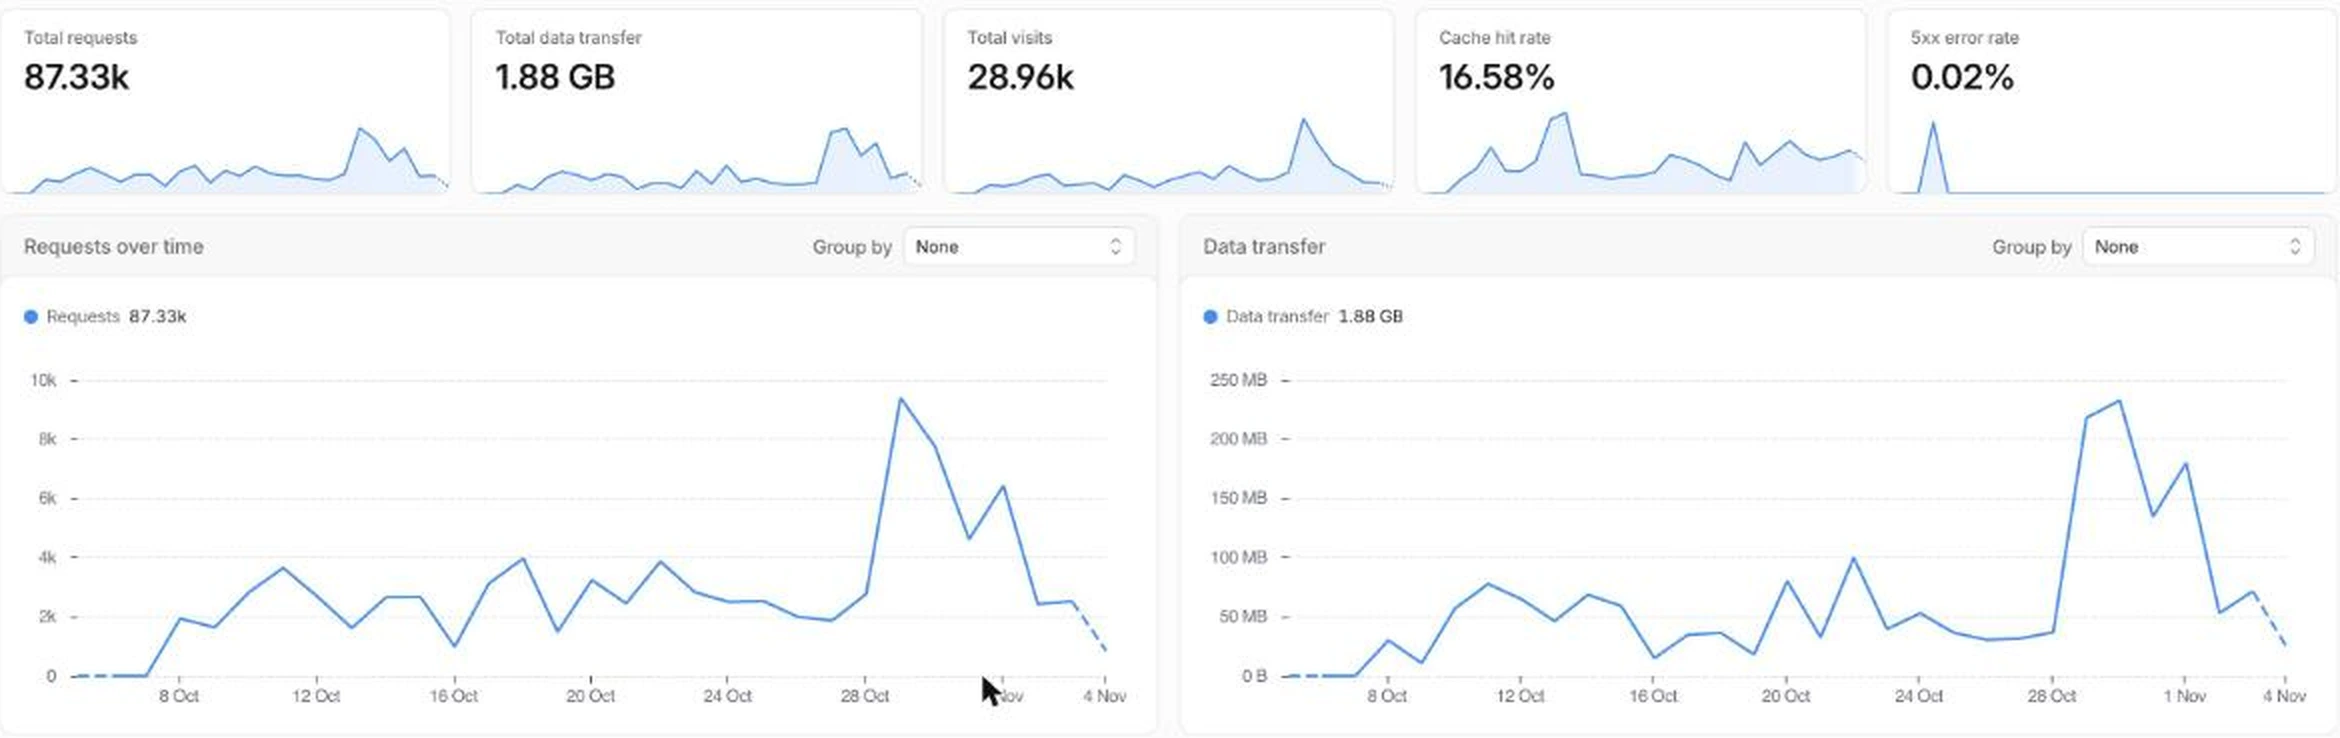
87.3k
Requests across the whole domain
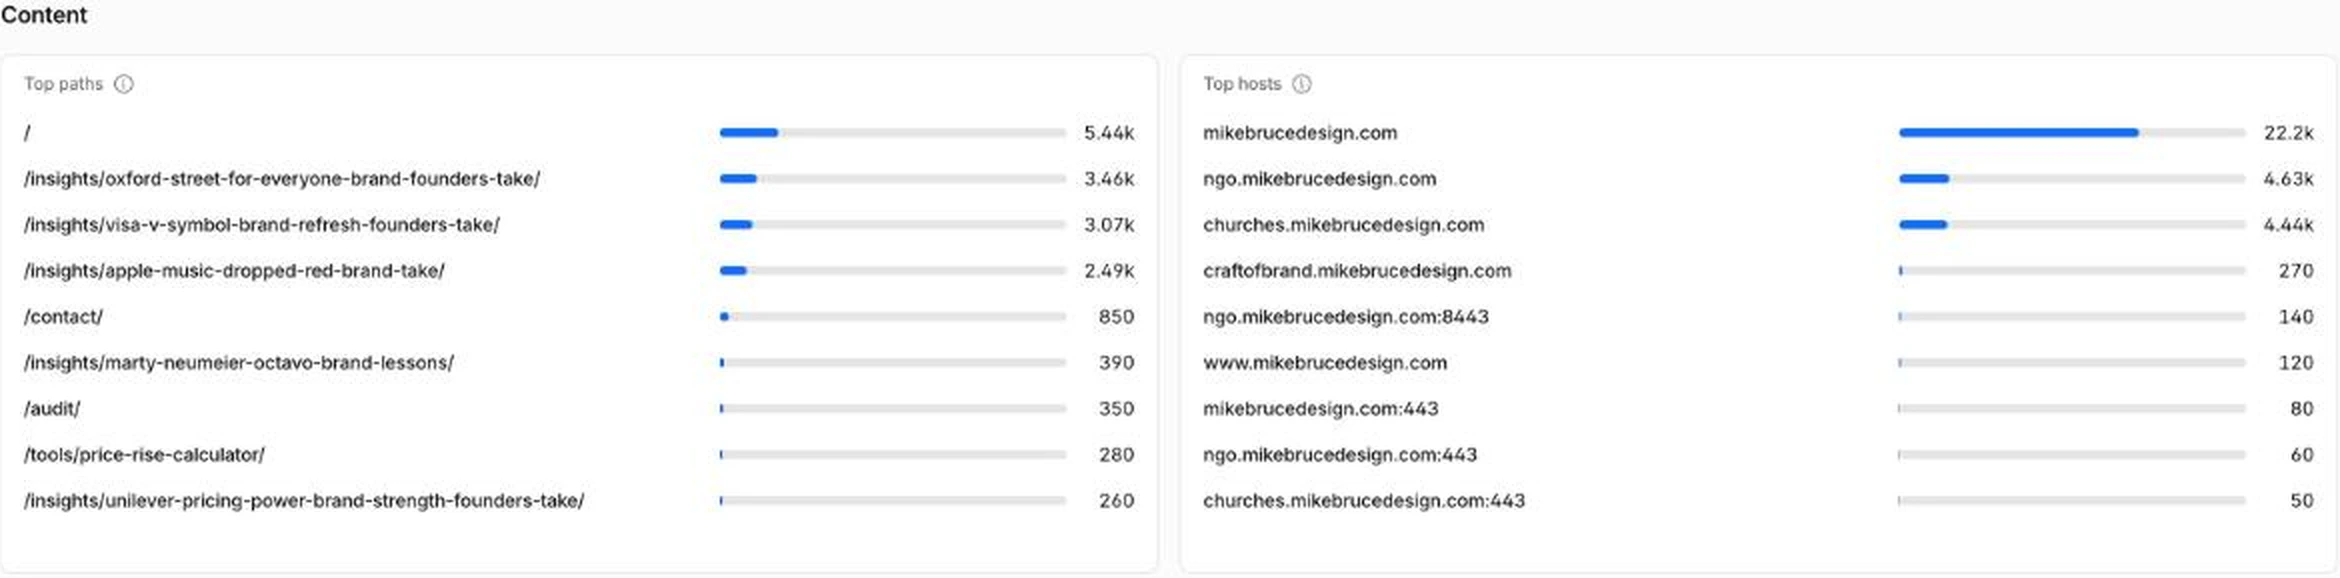
Includes images, scripts, crawlers and two offer sub-sites
$0
Spent on ads or paid traffic
No ads have run for this site and no traffic was bought.
| Traffic type | Pageviews | Share |
|---|---|---|
| Browser traffic | about 11.1k | 50% |
| One desktop Linux Chrome 138 signature, treated as automated | 7.53k | 34% |
| Link-preview fetchers (Facebook, Meta) | 2.58k | 12% |
| Search crawlers (Bing, Google) | 0.73k | 3% |
| Command-line tools (curl) | 0.29k | 1% |
Source: Cloudflare Analytics for mikebrucedesign.com (free plan), Visitors view with the filter Host equals mikebrucedesign.com, last 30 days to 4 November 2026, read on 5 November 2026. The screenshots on this page are unedited crops of the dashboard.
What the numbers do not say
Cloudflare counts machines as well as people.
Cloudflare counts traffic at the edge, before a visitor's browser loads the page. That includes search crawlers, link previews made when someone shares a link, and scripts. We have removed the ones we can identify. We cannot prove that every remaining pageview is a person.
The United States leads, but US-based crawlers, including Facebook, Bing and Google, sit inside that 72%. The better measure is the roughly 5,200 US browser-traffic pageviews, which is still the largest country.
Cloudflare's chart starts around 7 October, so there is no before-and-after comparison on this page. The spike around 29 October is unproven, and we do not count it as growth.
Cloudflare's free plan does not show referrers, so we cannot say which post, platform or search result sent each visit. We are adding analytics that count people only, and we will publish those figures here when we have them.
Questions people ask
The short answers.
How many people visited mikebrucedesign.com in a month?
Cloudflare recorded 22.2k pageviews and 19.75k visits on the main site in the 30 days to 4 November 2026. About half of the pageviews carry markers of automated traffic, so around 11,100 are browser traffic.
Where did the visitors come from?
Most recorded pageviews came from the United States: 16.06k of 22.2k, or 72%. Some of that is US-based crawlers. About 5,200 US pageviews are browser traffic, still more than any other country. Next were Germany (1.11k), Nigeria (880) and the United Kingdom (600).
Did you pay for ads or buy traffic?
No. We have not run any ads and we did not buy any traffic.
Why show the bot traffic?
Because a growth number you cannot trust is worthless. Showing the automated share is the same proof-first rule we ask of client work: baseline, decision, measured result, limits.
What did you actually do?
We applied the Brand Growth OS™ to our own site. Clarify set one position. Construct set one identity standard. Connect built the site architecture and a daily content system. Convert gave every page a next step and published the proof.
Will these numbers be updated?
Yes. This is a live case study. We will refresh the figures, add human-only analytics when they exist, and note every change at the bottom of the page.
Can you do this for my business?
We can apply the same system to your brand and your site, and we will show you the measurement plan before we start. Results depend on your market, your offer and the work you put in. Start with a Brand Clarity Call. Book a Brand Clarity Call →
Live case study. Last updated . We will refresh these figures as the data matures and note every change on this page.
The system in this work
- 01Clarify
- 02Construct
- 03Connect
- 04Convert
04 · Result & conclusion
In the 30 days to 4 November 2026 the redesigned site recorded 22,200 pageviews on Cloudflare, about 11,100 of them browser traffic, with no ads run and no traffic bought. The figure is real, the limits are stated, and the page will be updated as the data matures.